The Laboratory Experience
Including:
- Introduction
- The Lab Record
- Outline of a Lab Report
- An Example of a Lab Record
- Use of Lab Time
- Grading Rubric for Lab Writeups
- List of Labs
Introduction
Laboratory experiences are an important part of most science courses. Scientists and engineers are trained to keep records of their laboratory work in bound notebooks, so anyone considering a career in one of these fields should learn how to correctly keep such a notebook. Also, the College Board states that "Most college placement policies assume that students have had laboratory experience, and students should be prepared to show evidence of their laboratory work in case the college asks for it." For further information on the importance of labs in the AP Physics course, please read the appropriate section in the College Board's AP Physics Course Description (PDF download).
The Lab Record
A record of the work that you perform in the lab—your experimental procedure, qualitative observations, quantitative measurements, and even preliminary calculations—is typically recorded in a laboratory notebook. For a variety of reasons, you will not be required to keep a full laboratory notebook in this course.
Instead, most activities and labs will be guided by a protocol available from this website, and recorded and reported as individual assignments.
Most of these assignments will require you to set up an experimental situation in lab, run the system and collect data concerning both the set-up and the run. The write-ups will then ask you to deriving theoretical relationships that are appropriate to model the experimental situation (derivations should be formatted as shown in the video formatting derivations), then use the run's data and the theoretically derived relationships to see if the theory does, indeed, match up with the experimentally observed results (in other words, does the theory really model the physical world?). You will also have to wrestle with the ever present demon of "experimental uncertainty."
A few times during the year you will participate in a more comprehensive experience in which you will be required to create your own protocol to explore a given phenomenon, then do a write-up reflecting that work.
Under all circumstances, a write-up is expected to be an accurate record of the experimental work you perform in the lab. The document will contain a record of what you did, how you did it, and what your results were. Although the lab record may reflect your personal style somewhat, your records need to be formal, neat, and complete enough so that any reasonably knowledgable person familiar with the subject of your experiment—another student, or the instructor of this course—can read the protocol and your record, understand exactly what you did (using the formatting model will make all of this much easier on your reader), and repeat your experiment if necessary.
You need to write in black or blue ink, both when recording data and in your final writeup. If you make a mistake when recording data, draw a line through the mistake to cross it out, and add a small note indicating why the information you crossed out is incorrect.
In all cases, you should read the lab protocol in advance. When you come into the laboratory to perform an experiment, it is presumed that you will have already read the lab procedure.
In this class, there is no need for you to perform an extensive "pre-lab" write-up.
Outline of a Lab Report
Always write on the "up-side" of your Engineering pad. Do not write on the reverse side.
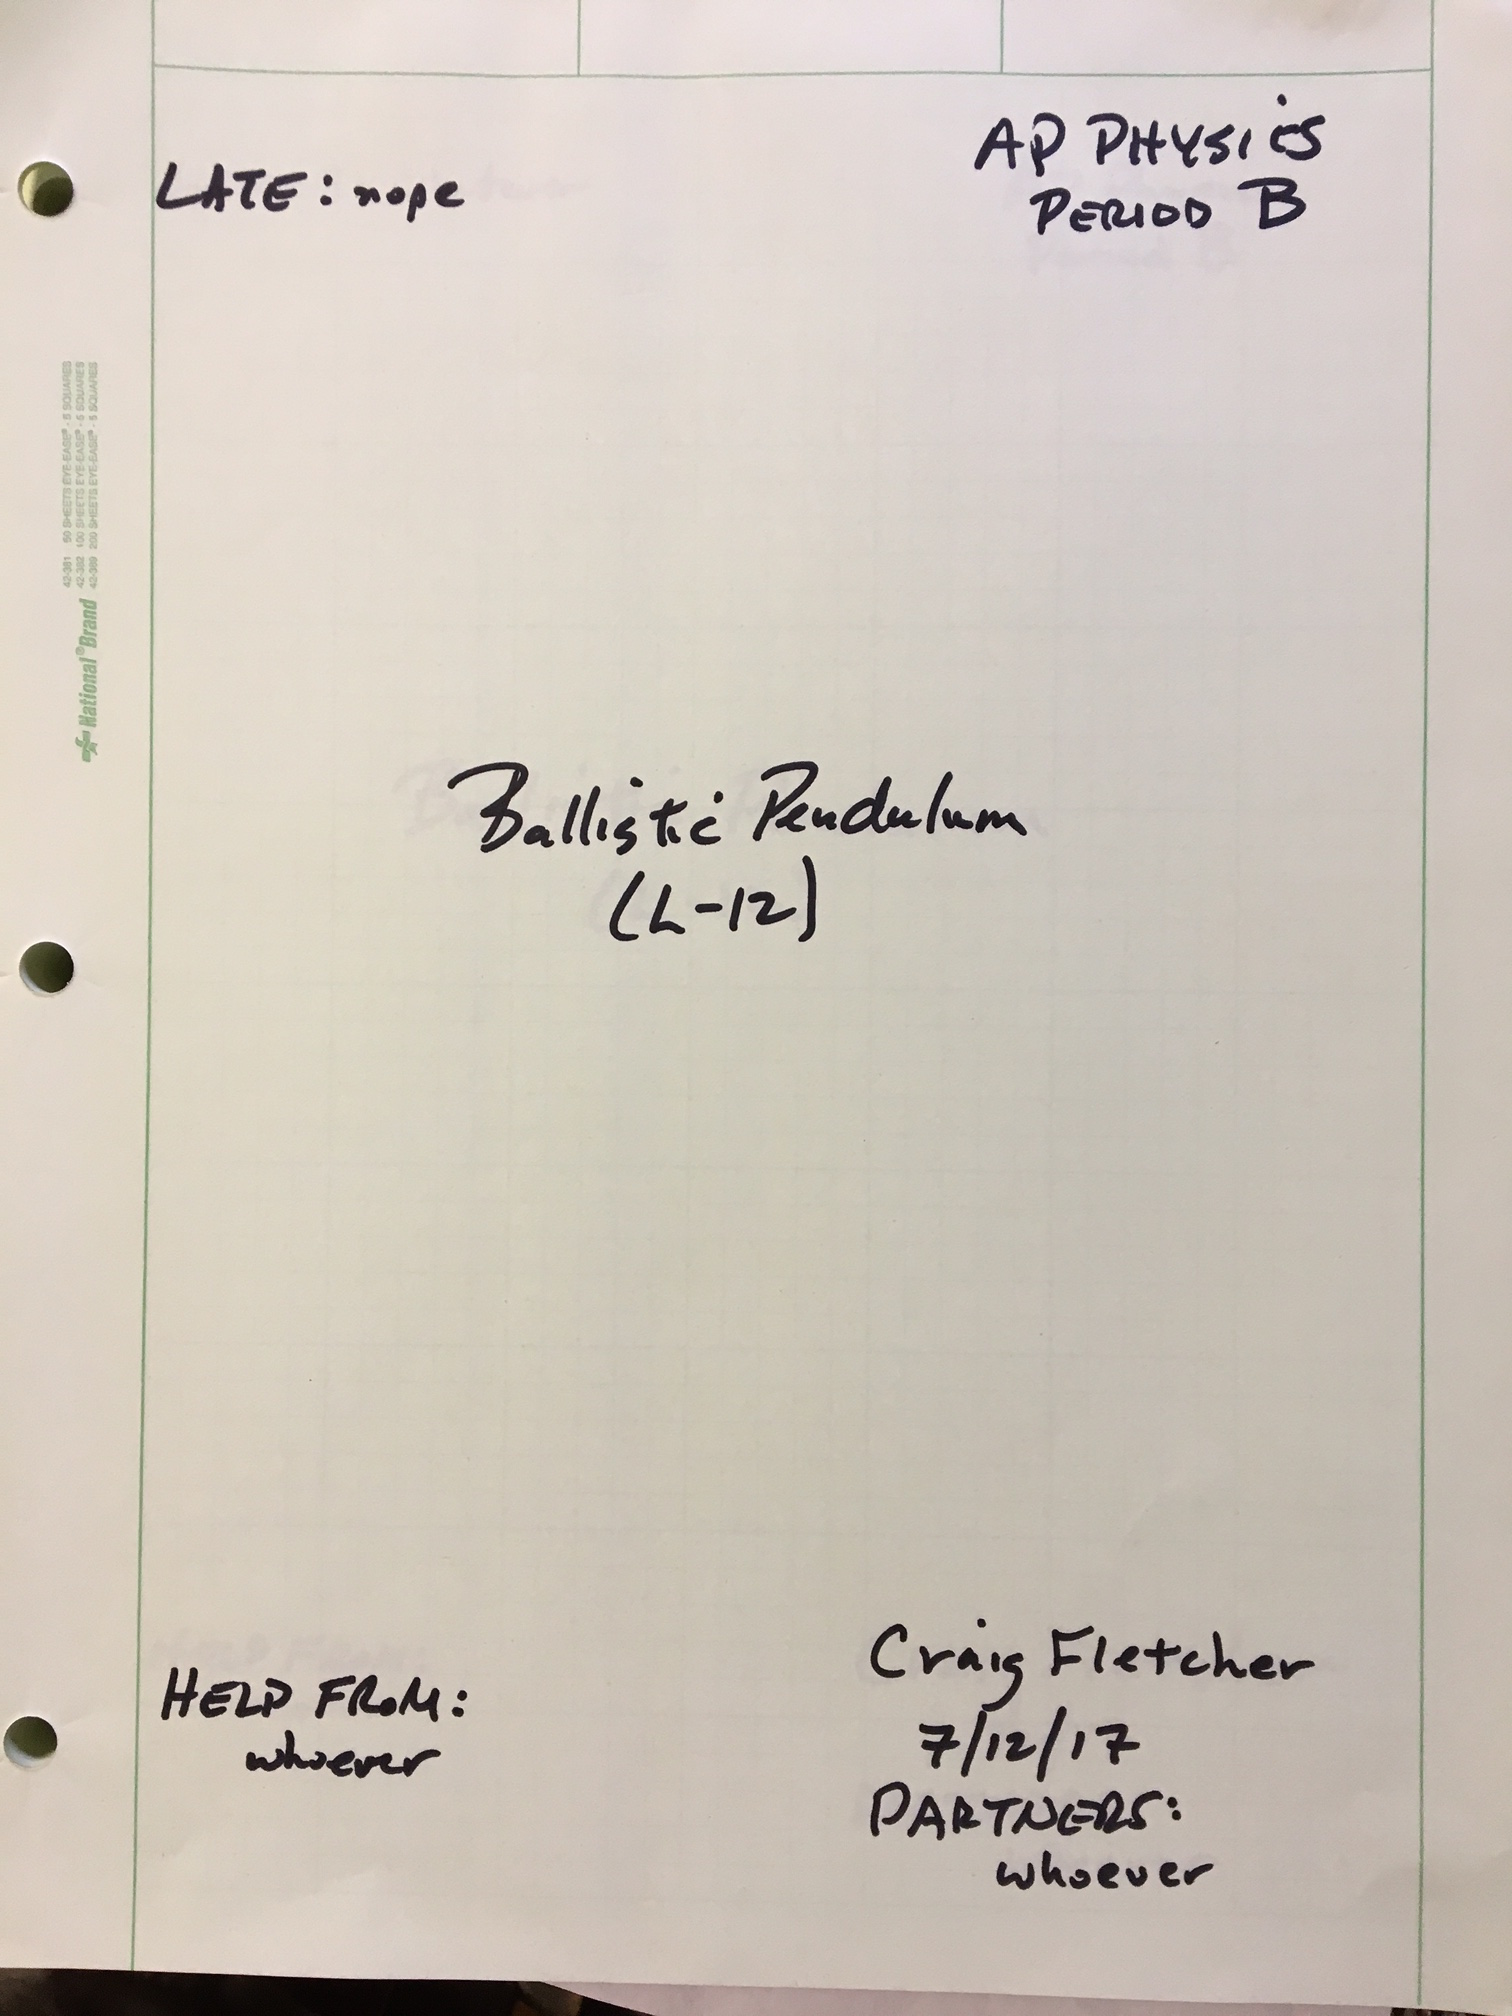
Decorating your lab cover is optional (see lab cover insanity for examples of what people have done in the past), but doing so is worth no points and is solely for the amusement of yourself and your friends. What is NOT optional are the lab cover features listed below:
- Your Name in the bottom right-hand corner (see example below);
- below your name, the Date
- below the Date, The Name(s) of Lab Partners
- in the middle of the page, the Title of Experiment
- below the Title of Experiment, the L-number (this will identify which lab it is for recording purposes)
- in the top right-hand corner, AP Physics
- below AP Physics, the Period
- in the top left corner a Late: statement (if you give me the lab late, I want to know the day you turn it in--example: Late: 2 days)
- in the bottom left-hand corner, a Help From: statement (if you've gotten help from anyone, list who here)
Internal to your document:
- Objective
This should simply be an elaboration of the title, possible giving the method used to conduct the experiment. (1-2 sentences) - Experiment Set-Up
Include a labeled sketch of the equipment set-up, details of component assembly, circuit diagrams, etc. If the set-up is included in the lab handout, it's easy enough to copy this drawing into your lab notebook. If this is a lab whose protocol you are creating, this is where you let the reader know how you have physically set up your experiment. - Table of Observed Data
Often, we'll be using computers to observe and record data collected in the lab. For these labs only, you may either attach personalized printouts to the back of your lab report or cut out the data table from the printouts collected in the lab and use adhesive tape to include them in your report. Either way, be sure to highlight or circle on these tables the important data that you used in your analysis. Also, when doing calculations, but sure to use points from any best-fit line you may generate for a graph, versus using actual experimentally determined data points (the reason you HAVE a best-fit line is to attempt to systematically reduce error, so the best-fit line's values will give you better values at a point of interest than will the actual data taken for that point). . - Non-tabled Data:
There may be other data that you need to record by hand on paper: the mass of a cart, the length of a pendulum string, etc. These measurements, too, should be presented in table form in your writeup. - Calculations and Derivations
If the lab is "cookbook" (that is, if it tells you specifically what to do by the numbers), you should preface each numbered or lettered section, if the section has Part a, Part b, etc, to it--with a brief blurb that identifies what is about to be done. In other words, anyone other than yourself reading the lab should be able to tell what you are about to attempt before you make the attempt in the write-up. - Any derivation or calculation necessary to yield final results should be neatly presented. That means:
- derivation should be ordered in outline form (this approach is, again, outlined in the video formatting derivations);
- numbers should be inserted at the end of the derivations or presentations of formulas used for calculations.
- Graph(s) of Results from LoggerPro:
Often, graphs of data collected in class will be prepared by the LoggerPro software. As with data tables, these may be attached to the back of your report or cut out and taped into the body of your report. Specific data points used in your analysis in the lab must be clearly identified on these graphs. - Graph(s) of Results Drawn by Hand:
Where appropriate, plot the data from your Calculations Tables on a graph.
Graphs drawn by hand must have a descriptive title, and X and Y axes labeled with quantity and units. Adjust the scale of your graph so that the information being presented fills an entire page of the paper. Data points, if plotted by hand, should be plotted with very small "pinprick" of ink, surrounded by a small, more visible, circle. When appropriate (nearly always) you should attempt to draw a smooth "best fit" line that reflects the general trend of the function. This line will not necessarily connect all of the points (see note at end of #3). - Discussion
The Discussion section of each entry is used to summarize your findings in paragraph form. Typically, the Discussion section will include:- Comparison with Known Values and Error Analysis
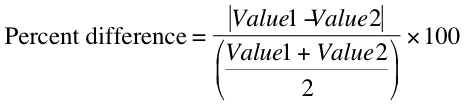
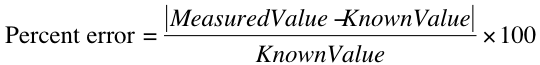
Compare your results with known values -- how close are your findings to accepted values? Any time that your results have been obtained by more than a single method, or a standard value is available for your result, you must calculate the "percent difference" (in the case of results obtained by two different methods) or "percent error" (in the case of a result compared to a known quantity).
To calculate the percent difference between two measured results, use the formula:
To calculate the percent error between a measured result and a known value, use the formula:
- Comparison with Known Values and Error Analysis
- Sources of Experimental Error
[Thanks to E. Santochi and K. Hatch-Harrison for much of this section]
"Experimental error" refers to variability in results due to limitations in the experimental design; it's the reason scientists perform multiple trials of any given experiment, and report their results as a statistical average with a plus or minus deviation included. (In this course, although we will often average measurements, we'll rarely do more advanced statistical analysis). In the "Sources of Experimental Error" section of the report, do list any observed reasons that you feel may have contributed to errors in your experiment, including specific problems with the equipment, difficulties in reading the equipment, or limitations in the design of the experiment. Don't just guess about why your experiment might have gone wrong—only mention specific sources of error that you have a legitimate reason to believe affected your results, and explain how those sources of error affected your results, e.g. "The average final velocity of the pendulum was 15.6% smaller than it was at the top, which we presume is at least partly caused by loss of energy due to air friction as the pendulum swung down." (Please note: Do not knee-jerk with "air friction" every time your results are off . . . in most cases, air friction does very little to affect the results of an experiment.)
Please don't refer to "human error." Examples of so-called human error include misreading a ruler, adding the wrong reagent to a reaction mixture, mistiming the reaction, miscalculations, or any kind of mistake. Scientists would never report the results of an experiment affected by human error—instead, they repeat the experiment more carefully. It is presumed that if you realize that you've made a mistake, you'll go back to repeat the experiment, after class if necessary.
Points will be deducted from your lab report if you discuss "human error" instead of "experimental error." - Questions and Answers
Restate in truncated form any questions posed in the lab handout that you haven't already answered in the course of your entry, and provide answers in complete sentences. NEVER begin an answer with the word "because . . ." - Summary of Results
This is a brief, one-paragraph, summary of the results of this experiment, with a discussion of whether or not you think the experiment supports your hypothesis, or the subject material covered in class. Please note that science is unable to "prove" anything, so an experiment that measures forces, masses, and accelerations will never "prove" Newton's Second Law. We often try to "confirm" our physical descriptions of the world, however: your measurements might (and should!) confirm the validity of Newton's Second Law.
By way of neatly summarizing the success of the lab, you should include a restatement of the most significant values calculated, which most often will simply be the percent error or difference you calculated.
Please note that although the instructor hopes you enjoyed the lab experience, or at least appreciated it, it's not appropriate to include any remarks on how you felt about the assignment, nor whether or not you liked it.
An Example of a Lab Entry
You might find it instructive to see an actual example of a lab entry completed by a student. This particular entry was a 5-page report on a Ballistic Pendulum experiment. While the report differs somewhat from the format that you'll be using for your reports, it's an excellent example of the kind of "look-feel" that is expected in a lab record.
Use of the Lab Time
Before the Lab PeriodMake sure that you've looked over the lab and have a good idea of what you're going to be doing during the lab period.
During the Lab Period
On a typical lab day you'll come in, listen to the teacher's instructions on some of the finer points of using the lab equipment, and settle in to conducting the lab: getting equipment, setting it up, calibrating it, running the experiment, performing a few calculations to check that your results are satisfactory, and then breaking down the equipment and putting it away (please be careful to put things back where you found them).
Most labs are designed for most people to complete within the allotted time period. Students who haven't prepared adequately, who perform the experiment poorly the first time, or even have a faulty piece of equipment, may find that they'll need a small amount of additional time to complete the experiment. If you manage to finish the lab and clean-up before the end of the lab period, you are expected to stay in the classroom to begin working on the remaining sections of the lab report.
After the Lab Period
Students will need to complete the remaining sections of the lab entry before turning in their completed lab on whatever day is assigned for turn-in.
It is expected that you will collaborate with lab partners and other students in the class—you are encouraged to discuss the lab, and even to consult with others as you complete the lab write-up. However, each students is expected to complete his or her own lab write-up, with all calculations, analysis, and written entries completed in his or her own words.
Grading Rubric for Lab Writeups
Lab writeups are typically worth 20 points, but that value may vary with the difficulty of the experiment. The amount of points earned by a student on each entry or report will be determined according to the following rubric:
- 100%
The student demonstrates an excellent understanding of the laboratory exercise. All parts of the lab notebook entry or the lab report are clearly labeled and in the correct order. The equipment and experimental procedures used are clearly identified and explained. The data and results tables clearly show correct data, calculations processes, and results. Graphs are appropriately and correctly drawn. The discussion is clear, displays logical reasoning, and correctly identifies and explains potential sources of error. Minor errors in the entry or report, if present, do not detract from overall understanding. Communication is clear and effective. The notebook is turned in on time. - 80%
The student demonstrates a solid understanding of the laboratory exercise. All parts of the lab notebook entry or the lab report are clearly labeled and in the correct order. The equipment and experimental procedures used are clearly identified and explained. The data and results tables show data, calculations processes, and results. Graphs are appropriately and correctly drawn. The discussion is clear, displays logical reasoning, and identifies and explains potential sources of error. Minor errors in the entry or report may be present. Communication is mostly clear and effective. - 60%
The student demonstrates a basic understanding of the laboratory exercise. The student has included most of the parts of the lab notebook entry or the lab report. The data and results tables show data, calculations processes, and results. Graphs are appropriately and correctly drawn. Major errors may be present. Writing may hinder effective communication. - 40%
The student demonstrates a limited understanding of the laboratory exercise. The student has included some of the parts of the lab notebook entry or the lab report. Major errors and misconceptions are present. Writing may hinder effective communication. - 20%
The student demonstrates minimal understanding of the laboratory exercise. The student has included few of the parts of the lab notebook entry or the lab report. The data and results tables show data, calculations processes, and results. Major errors are present. Writing may hinder effective communication.
Partial List of Labs for the 2021-2022 School Year
These are the probable labs and activities currently scheduled to be performed by AP Physics C students this school year. There may be changes as time and circumstance dictates. For more specific information on labs, see the Course Schedule/Calendar for your particular period.
First Semester
- Activity: Determining Velocity
- Lab: 1-D Kinematics: Acceleration of a Cart (Computer-based data collection)
- Activity: Bus Jumping
- Lab: 2-D Motion: Catch the Ball
- Lab: Newton's Second Law of Motion (Inclined plane)
- Lab: Newton's Second Law of Motion (Friction)
- Activity: Friction and Normal Force
- Activity: Circular Motion: When Pigs Fly
- Activity: Circular Motion: Motorcycle Friction
- Lab: Circular Motion: Penny on a Turntable
- Lab: Conservation of Energy: Pendula
- Lab: Collision and Impulse (Air Track w/Photogates)
- Lab: Conservation of Momentum: Ballistic Pendulum
- Lab Project: Rolling Objects
- Lab: Hooke's Law
- Lab: Air Friction: Finklebottom & Priest
Second Semester
- Lab: Electric Fields
- Lab: Millikan's Oil Drop Experiment
- Activity: Electric Field of a Flat Conducting Disk
- Lab: Ohm's Law
- Activity: Series and Parallel Circuits
- Lab: Physics of Amusement Parks
- Lab: RC Circuits
- Activity: Electrons in a Magnetic Field
- Lab: Building an Electric Motor